Understanding the health of your business is important to your success and growth. That’s why we added new insights to your MemberSpace dashboard that help you track the performance of your products and pricing options!
New dashboard analytics
The new and improved dashboard now includes detailed revenue data, updated graphs, enhanced analytics, and customizable filters to help you better know which plans and content are performing the best and identify areas for improvement.
View data for specific plans and time periods
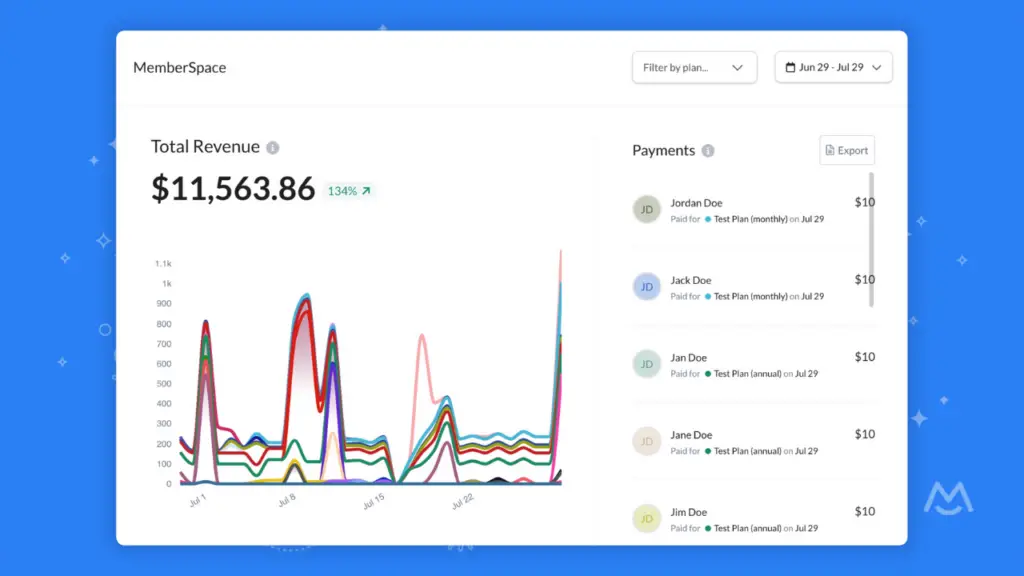
You now have control over the data you see in your MemberSpace dashboard. By default, your dashboard shows data from all plans over the last 7 days. But with the addition of plan and date range filters, you can now break down your dashboard analytics by specific plans and time periods.
Select one, multiple, or all plans. Then, adjust the time span to view data from the previous 7, 30, 90, or 365 days, or select year-to-date. You can also set custom date ranges.
All dashboard data and analytics will update based on the filters you choose.
Throughout the dashboard, you’ll also notice arrows that show how your data has changed by percentage compared to the previous period. For example, if you’ve selected the past 30 days, the arrows show the difference compared to the 30 days before that.
NEW!
Detailed revenue data
New revenue data helps you keep track of your online business income. View your total revenue based on the filters you’ve selected, or check out the interactive graph that breaks down your revenue by plan. See specific days in more detail and easily track which plans generated income and the total amount for each one.
The list of member payments gives you a deeper look at the plans they joined as well as the transaction dates. You can export this data using the button at the top, or if you’d like to view a specific member’s full event history, simply click the member’s name.
As always, you can review the total revenue from failed payments and signups that we’re working to recover, as well as the revenue we’ve already saved for you.
✨ Identifying your top-performing plans can help you focus your marketing efforts on what works best and optimize your pricing strategies.
Memberships breakdown
Easily see how many active memberships you have at any given time. Your total active membership count is based on the plans and last date you selected. In other words, if you choose to view data from the last 30 days, the total reflects the number of active memberships you had as of the 30th day.
Coming soon!
See how your total membership count has changed by percentage over time. This metric is calculated differently than the others, as it compares the cumulative membership total from the starting date to the ending date of your selected period.
A breakdown of your membership data provides more insight into new and canceled memberships, trials, as well as upgrades and downgrades. If you have any questions about how a metric is calculated, just hover over the help icons to learn more!
The graph shows your cumulative active memberships by plan, making it easy to see how many members were on a specific plan on any given day. For more information about your memberships, including a breakdown of paid and free members, click View All.
Products and content performance tracking
See how many times your products have been viewed within your selected time period. These views are from all products across all plans, regardless of any specific plan filters you’ve applied.
The graph breaks down your total product views by date. For more detailed information about which products and specific members-only pages were viewed, and how many views each received, click View More.
If you’re using Content Links, you’ll see the total views for all Content Links across all plans within the selected dates. Click View More Details to see which Content Links were viewed and the number of views each received.
When looking at both product and Content Link views in more detail, you’ll have the option to export that data.
✨ Understanding which content resonates most with your members is key to the continued success of your business!
Let your most popular content inform your future plans for expanding your offerings. Providing the materials and resources your members want and need is crucial to keeping customers satisfied and sticking around.
Reviewing historical data
As of August 8th, 2024:
- Membership analytics reflect ~1 day of historical data. Moving forward, data will be tracked and stored for future viewing.
- Revenue data from the past 30 days is currently available. Within 25 days after August 8th, all historical revenue data will be restored.
Customers who joined before August 8th, 2024 can access the old dashboard for the next 30 days (following the release of the new dashboard) to take screenshots of any data or graphs you’d like to preserve. To access the old dashboard, simply visit the new one via the Dashboard link in your left navigation and click the View old Dashboard link at the top.
We hope the new dashboard and the valuable insights it provides make managing your online business even easier!